Last time, we had an introduction to ROS diagnostics. I explained how nodes publish diagnostics data and how the aggregator organizes them for a more convenient monitoring. Now, we’ll see how you can set everything up, and have the analyzers react to error conditions by sending notifications. The code discussed in the post is available on github. Feel free to check out the code as you read the post.
I mentioned before that the interface between an updater and a device is a task. A task has a method run that has to be defined. It’s the method that the updater calls with a status message to be filled. The updater is available both in C++ and Python. Focusing just on C++ for now, a task is defined by extending the diagnostic_updater::DiagnosticTask abstract class and overriding the run method. Apart from this, you can define any other methods you need in order to set the state of your device in the task (e.g. setState). Then the task will be able to read that state and populate the status message. Once an instance of a task has been defined, you can add it to the updater, and then the updater will keep querying the task every second (the default publish period) for a new status.
class StateTask : public diagnostic_updater::DiagnosticTask {
 public:
  virtual void run(diagnostic_updater::DiagnosticStatusWrapper &stat) override;
  void setState(MyState state);

 private:
  MyState state_;
};
Now, execute the following command to start the updaters.
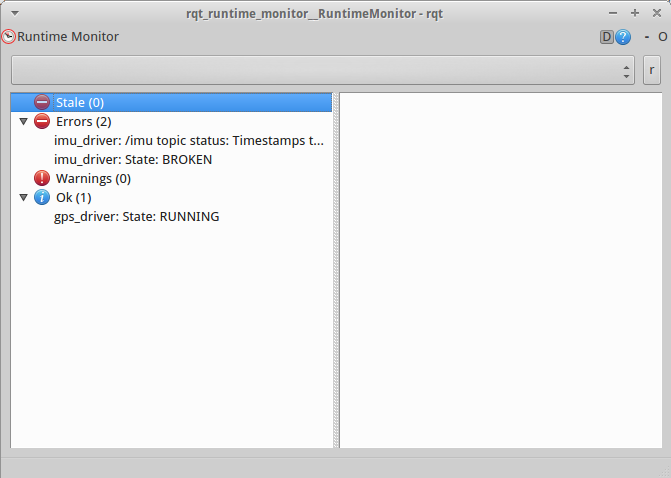
roslaunch diagnostic_updater_example updater.launchThis launches two simulated drivers, an IMU and a GPS. They both publish a status for their state that oscillates between RUNNING and BROKEN. The imu driver has additionally a DiagnosedPublisher for its imu data topic. A DiagnosedPublisher is like a regular publisher, but with an associated task. This task inspects the frequency and timestamps of the published messages. In the case of the IMU, these variables have been randomized to occasionally show errors. Both drivers have been configured such that you can later observe how the aggregated diagnostics are affected.
Now, it’s the time for the aggregator. To configure the usual hierarchy we talked about before, you don’t have to write any code. You just have to specify a yaml file with the analyzers.
pub_rate: 2.0
analyzers:
  sensors:
    type: diagnostic_aggregator/GroupAnalyzer
    path: Sensors
    analyzers:
      imu:
        type: diagnostic_aggregator/GenericAnalyzer
        path: IMU
        find_and_remove_prefix: imu_driver
        num_items: 2
      gps:
        type: diagnostic_aggregator/GenericAnalyzer
        path: GPS
        find_and_remove_prefix: gps_driver
This yaml file can have 3 parameters:
- The
pub_ratewhich is the frequency at which the aggregator publishes to the /diagnostics_agg topic. - The
base_path(and a secret one,path) which adds an additional root level in the hierarchy (e.g. /MyRobot/Sensors/IMU/…). But it’s useless, since there can only be one aggregator in the system, and so the separation between different robots cannot happen at this level. Thus, you can simply ignore it! - The
analyzerswhich is a list of… you guessed it, analyzers. The analyzers have a type, a name (a.k.a. path), and several options for matching criteria. The type can beGenericAnalyzerwhich does a grouping of status items based on their name orGroupAnalyzerwhich does a categorization of analyzers (e.g. Sensors/IMU, Sensors/GPS).
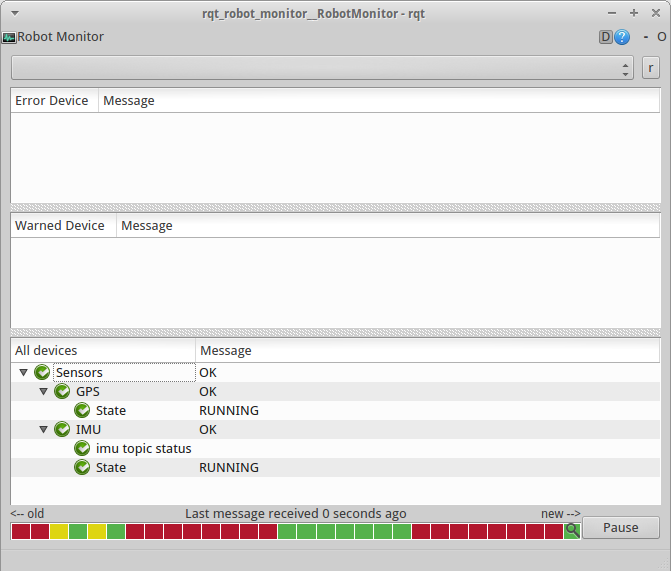
The above yaml file creates the following hierarchy which can be observed through the robot monitor. The single aggregator constraint is imposed by the robot monitor. If you try to run two aggregators in parallel, the contents of the monitor will keep changing between the messages published by the one aggregator and the other.
Now, comes the interesting part. What if we want to react to an error? We’ll have to write an analyzer that does this. In contrast to tasks, analyzers are written only in C++. But we won’t just write an analyzer. Since the categorization offered by the default analyzers is always relevant, we’ll extend the generic or group analyzers so that we maintain their functionality. The analyzers have two methods that can be of interest:
- The
analyzemethod which can be useful for processing the data of a status message before we store it. - The
reportmethod which can be used to make a decision based on the status messages to be reported by the analyzer.
In the accompanying code, there are two analyzers. One is based on the GroupAnalyzer and the other is based on the GenericAnalyzer. They both rely on the report method. They look at the reported statuses by their parent class and they publish a message if a condition is met. The SensorsAnalyzer finds the group (/Sensors) status and reacts when its level transitions from OK to something else. The ImuAnalyzer finds a requested status message (e.g. ‘imu topic status’) and reacts when a certain error appears (e.g. ‘Frequency too low’). Any required parameters are provided in the yaml file.
Now, execute the following command to start the aggregator. This also starts the robot monitor.
roslaunch diagnostic_aggregator_example aggregator.launchOpen a new terminal next to the robot monitor, and type the following commands, one at a time.
rostopic echo /sensors_status
rostopic echo /imu_status
Try to correlate the states on the robot monitor to the messages appearing on the terminal. When an error happens, a critical decision is made and a message is published. Then, the message can be received by a node which will react to the error, e.g. stop the execution of an action.
This has been a short introduction of what the ROS diagnostics are and how they can be used. Now that you have the essence, you can go through the documentation and code, as necessary, and fill in any gaps, with no struggle.
I hope you found this information practical. See you in the next post.